Financial dashboard with Neo4j and NeoDash
- George Martens

- 1. Feb. 2022
- 2 Min. Lesezeit
Aktualisiert: 21. März 2022
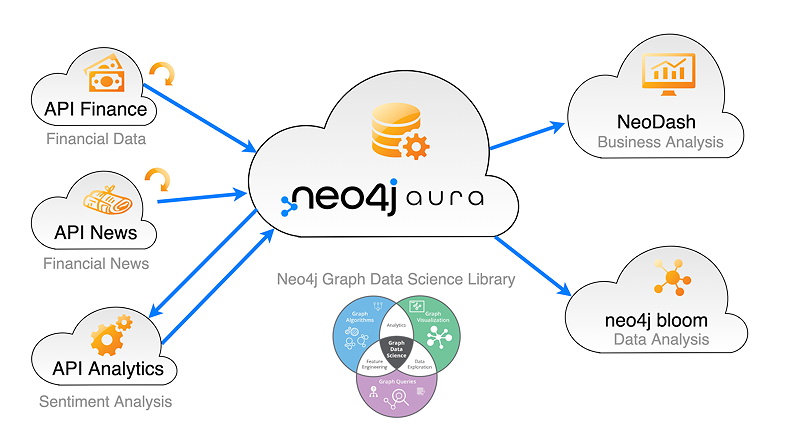
Advanced financial dashboard solution build with Neo4j & NeoDash
Database : Neo4j Aura (Cloud) & Neo4j Desktop
Data Source : Fintel.IO, SerpWow.com , Polygon.io (Financial Market Data Platform)
Technology : Cypher Query Language, Neo4j APOC Library
Dashboard : Neo4j - NeoDash
Purpose : PoC - Create a new tool for investment strategies
Developed : March 2022
Last update : 21.03.2022 (updating all day)
This month, we are proud to highlight the implementation of a proof-of-concept for a 100% cloud-based financial dashboard solution powered exclusively by Neo4j technology.
Particularly noteworthy is the simple and intuitive use of NeoDash which offers the quick and easy creation of comprehensive dashboards. The data can be easily visualized using tables and graphs in a simple modular way. Additional components like "Parameter Select" allow to create an Interaction with the data.
More than just fancy data visualization
21.03.2022..... text and concept... ( 5 Steps) ...... draw in DrawIO today!

1. Internet as data source
The datasource is the internet. Direct API calls with JSON responses provides the data that is loaded in the Neo4j graph database.
For this PoC we use a daily feed from Fintel. Currently up to 18'000'000 Attributes are available in the database and ready for analysis.
2. Loading the data
The data from the API calls and the data from the advanced analysis are combined in the dashboard data summary page. As of 21/03/2022, 900k records with a total of 17M attributes are available.

2. Enriching the data
Daily data is the base. But additionally we enrich the data with additional calculation and create new data that is in focus for daily investment analysis.
3. Creating "the big picture" using NeoDash
When it comes to understanding the data, a top down approach seems to be the best choice. The first page of the dashboard provides an overview of the current data that is provided by the API. This creates a structure and serves for data validation.
NeoDash organizes the Pages in using tabs.
21.03.2022..... text
NeoDash organizes information in modules
21.03.2022..... text
NeoDash highlights important values using individual styles
Neodash features advanced styling that enabled to highlighted relevant data in charts and data grids. Trends and thresholds become visible.


NeoDash combines modules to create a flow
21.03.2022..... text

A filter now offers the possibility to dive into a stock and visualize associated data. The daily data is combined with past data in line graphs which gives an overall picture of a stock. Trends and correlations of the individual attributes are now visible.

4. Searching for patterns
21.03.2022..... text


Drilling down on 18'000'000 pieces of information


5. Implementing dynamic analytics on large data (21.03.2022)
The next step


Kommentare